Network
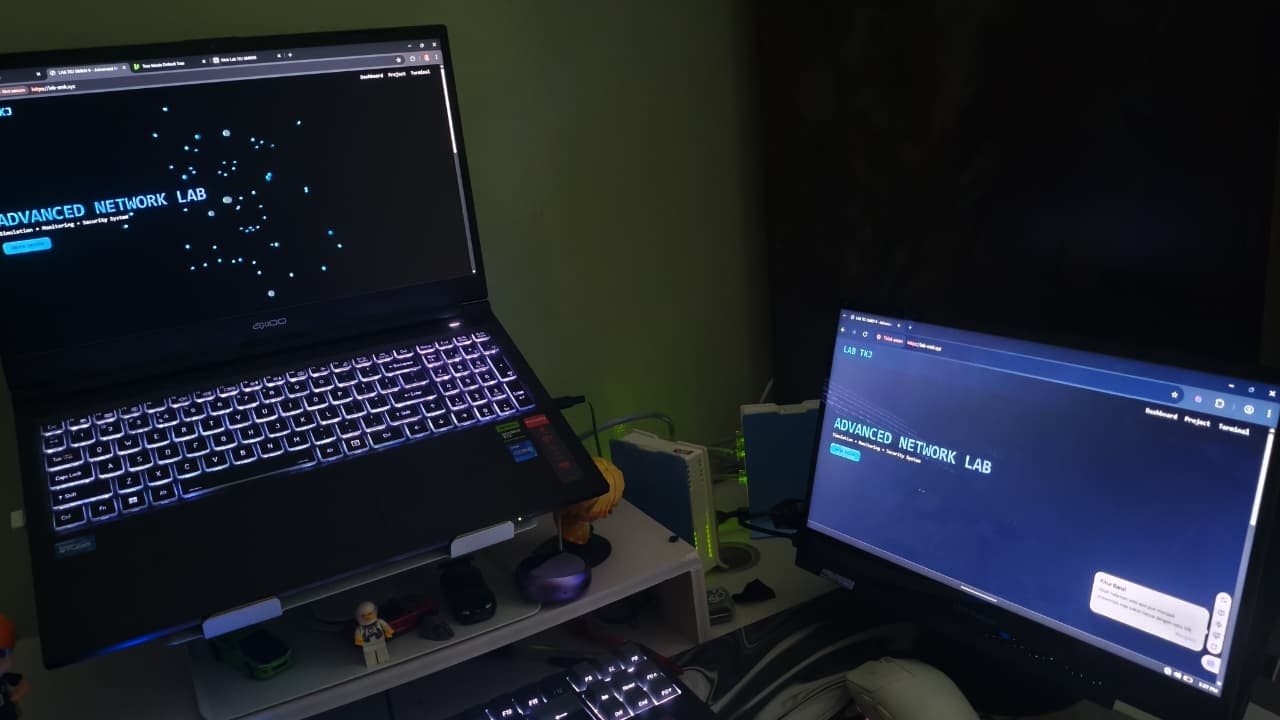
Monitoring Dashboard
A networking project developed to explore real-time monitoring concepts, device management, and data visualization while strengthening my skills in web development and network infrastructure.
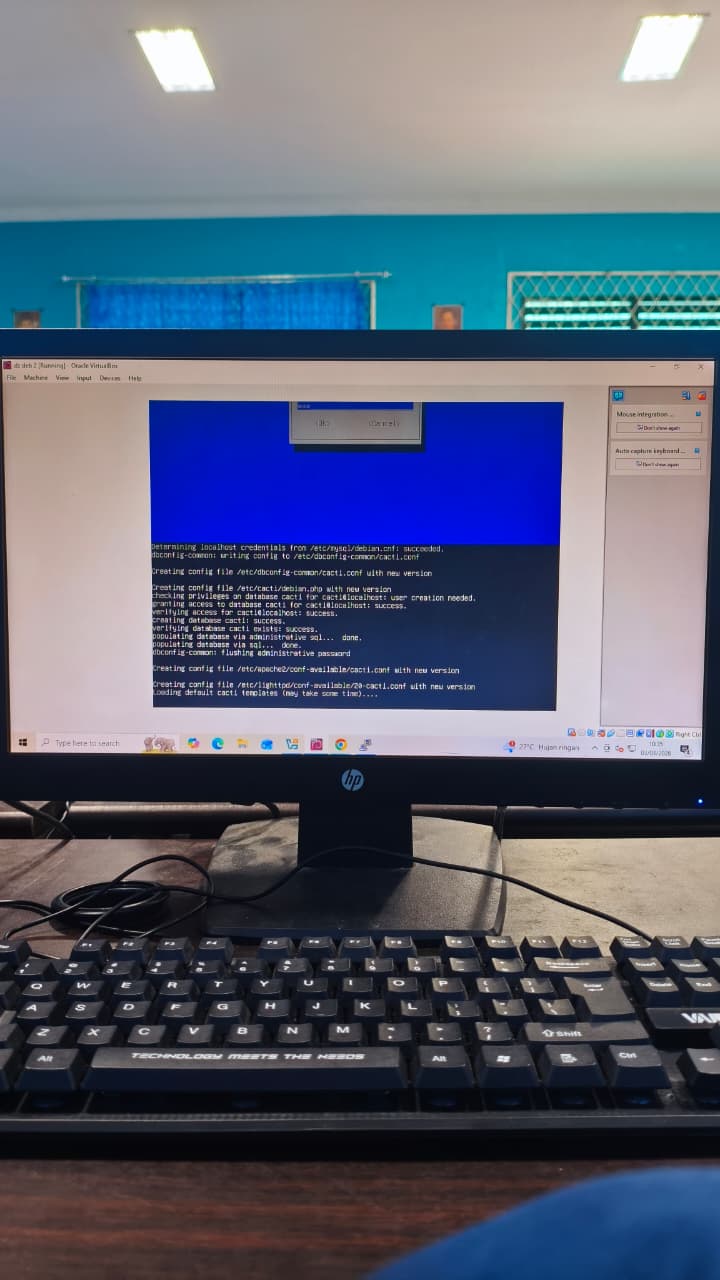
Project Gallery
Explore the dashboard interface, network topology, and monitoring capabilities.
Project Overview
What Problem It Solves
Understanding network activity can be difficult when information is scattered across multiple devices and interfaces.
This dashboard provides a centralized view of network information, helping users visualize connected devices, traffic activity, and network performance through a simple web-based interface.
Why It Was Built
As a TJKT student, I wanted to combine networking knowledge with web development skills by creating a dashboard that makes network information easier to understand and analyze. The project allowed me to explore data visualization, frontend development, and network monitoring concepts in a practical way.
Main Objectives
Visualize network information in real time, Display connected devices and network status, Improve understanding of monitoring concepts, Practice frontend and dashboard development, Create an intuitive user experience for network management.
Target Users
Network engineering students, IT support learners, System administrators, Teachers and instructors, Anyone interested in network monitoring concepts.
Key Innovation
The project combines networking concepts with modern web technologies to transform technical network data into an interactive and user-friendly dashboard experience.
How It Works
From discovery to actionable intelligence.
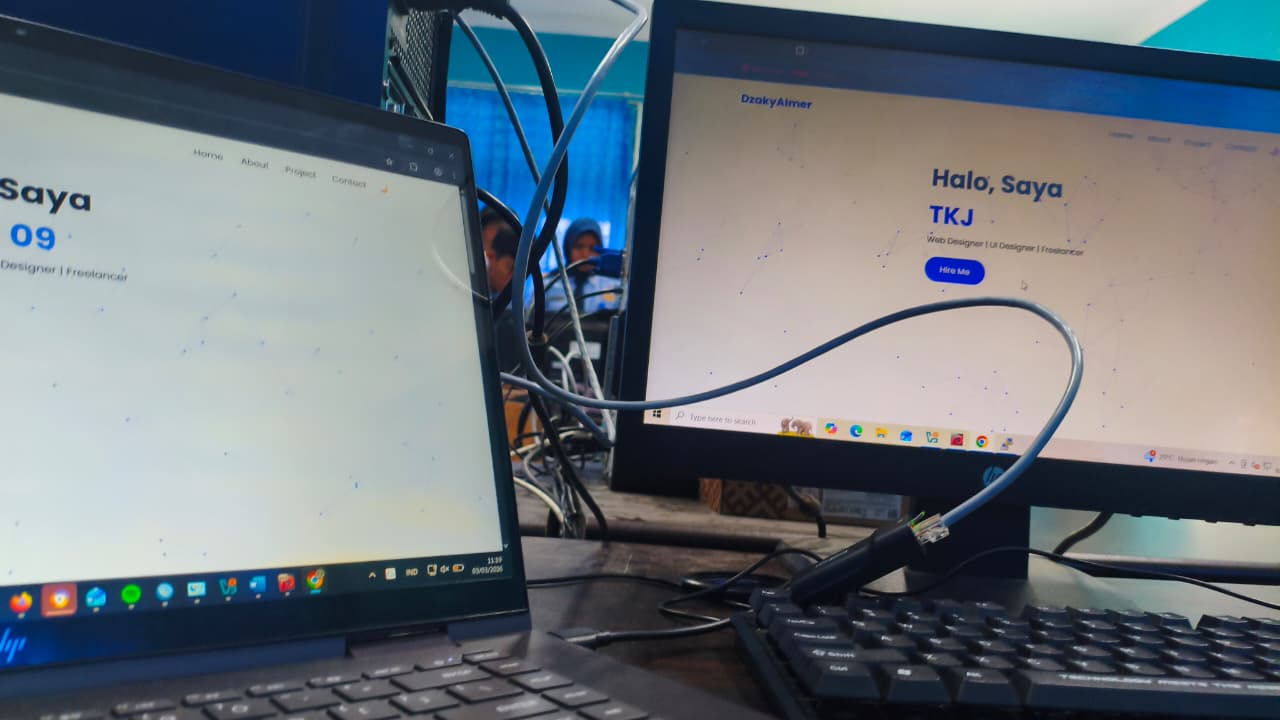
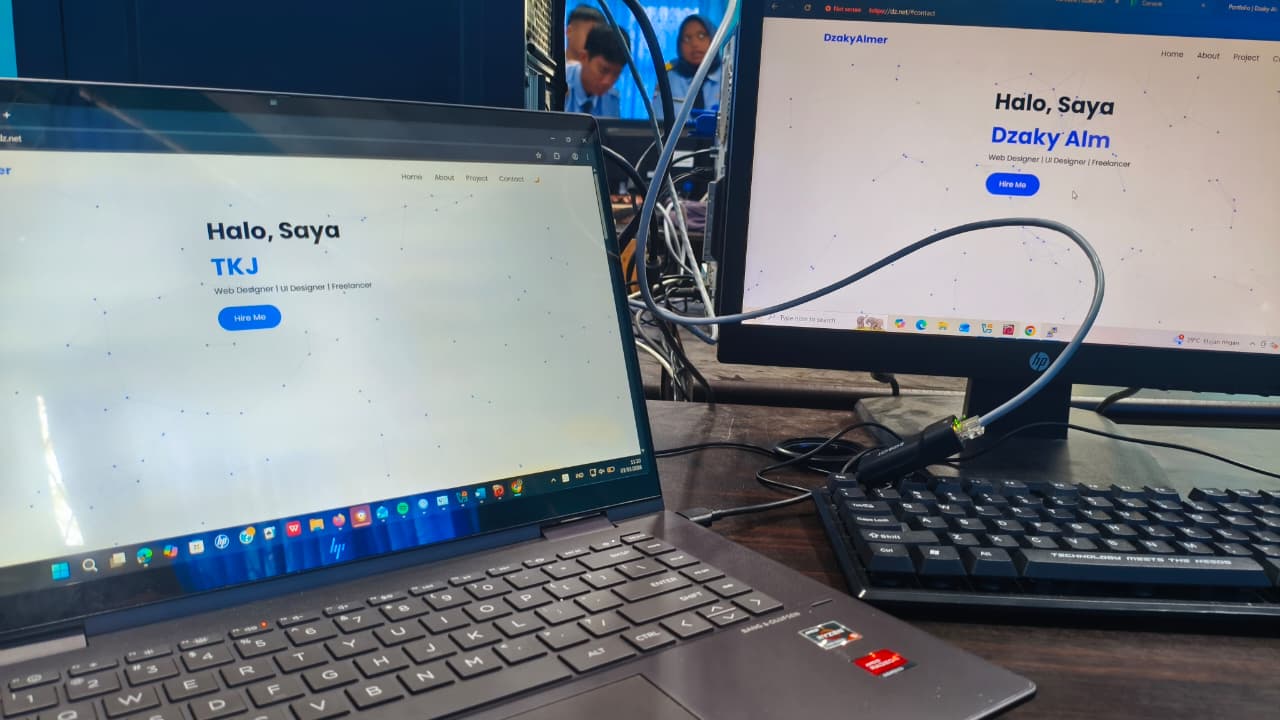
Device Discovery
The dashboard identifies and organizes devices connected to the network, helping users gain better visibility into their infrastructure and connected endpoints.
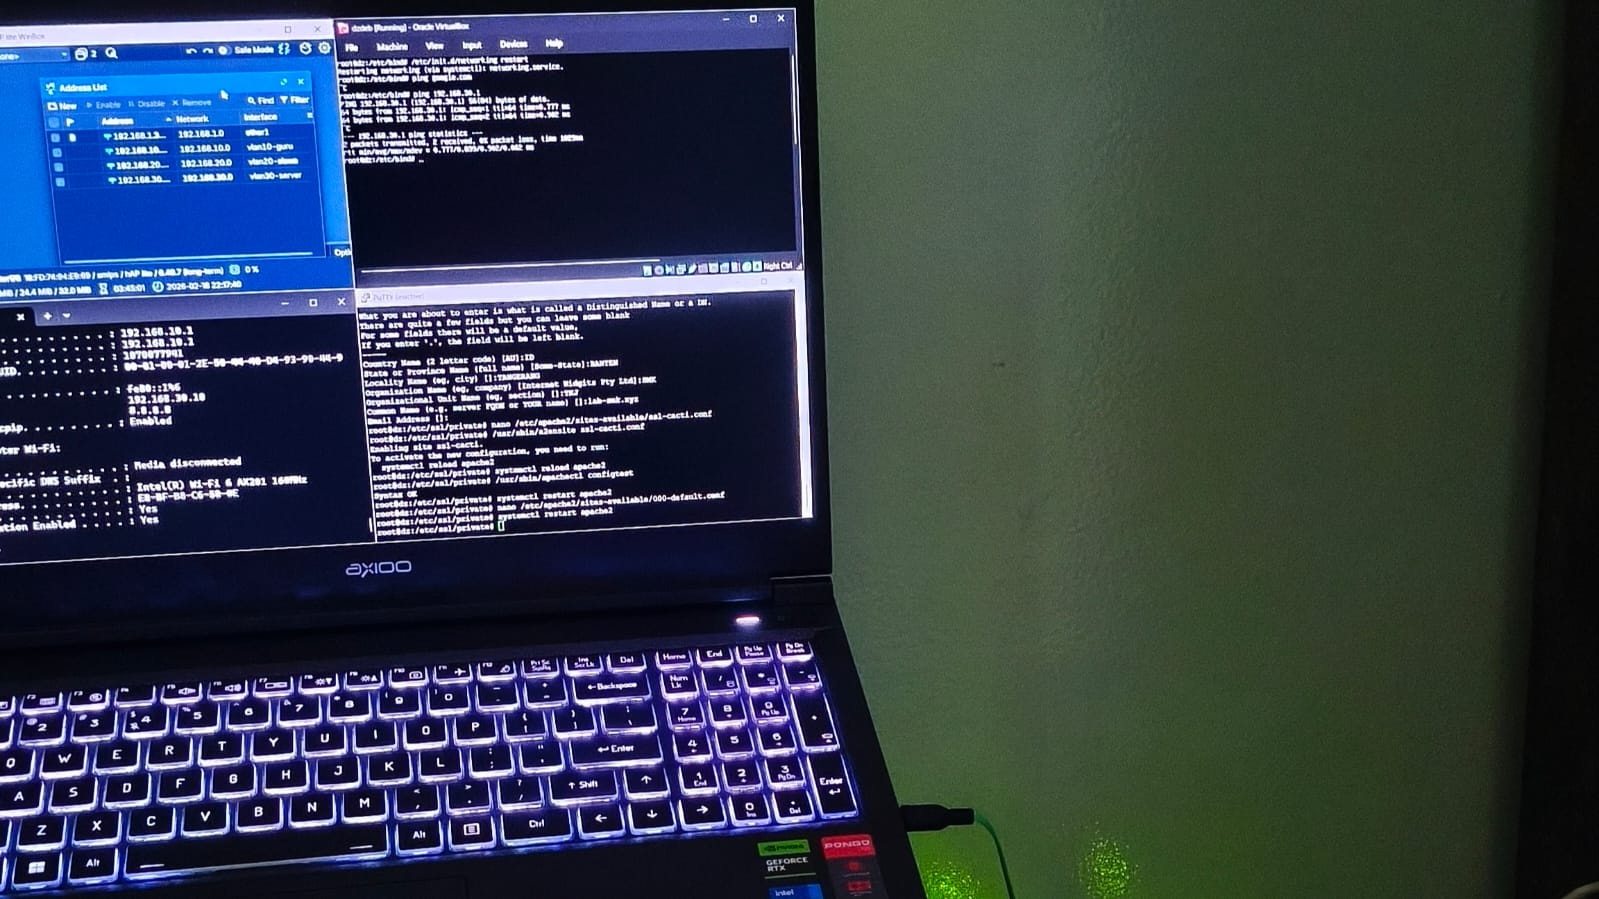
Data Collection
Network information is gathered from available sources and prepared for monitoring, analysis, and performance evaluation within the dashboard.
Data Processing
Collected data is structured and analyzed to generate meaningful insights, allowing users to better understand network behavior and activity.
Data Visualization
The dashboard transforms technical information into charts, graphs, and visual indicators that are easier to interpret and monitor.
Network Insight
Users can review network conditions, identify potential issues, and gain a clearer understanding of overall network performance through a centralized interface.
Performance Summary
The dashboard generates concise summaries and reports based on collected network data, providing users with a clear overview of network performance and operational status.
Technology Stack
The tools powering network intelligence.